17 Mar 2020
The Long Read: The Decade in Numbers (and Charts)
Hope you like Charts. Because we've got a decades worth of them.
By Conor Murphy
There were 3,651 days in the 2010s. Some call them the 'teenies', some the 'ten', we call them the decade when the Giants finished top of the game in the Northern Hemisphere for the first time in 81 years, the decade when we saw the careers of Jermaine McGillvary, Leroy Cudjoe, Danny Brough, Michael Lawrence, Luke Robinson and many, many more flourish in the Claret and Gold, and will be marked as the decade when the next generation; Louis & Innes Senior, Jake Wardle, Matty English and Oliver Wilson stepped into the limelight.
It's had good times; the Immaculate Interception, that final play at Craven Park and it's had bad times - we won't mention any in particular but don't click this link if you're having a tough time today. We've had nearly 100,000 plays, scored nearly 8,000 points and if you've watched every minute of every game in the last ten years, you've spent just over 14 days watching the Claret and Gold. Time. Well. Spent.
But with so many minutes, so many games and so many individual plays come stats, numbers and data that boils these numbers down into 1s and 0s, and charts. Lots of charts. So here's a breakdown of the numbers, wins, tries, goals and players that made the 2010s a decade to remember.
We like to leave it late... but didn't always
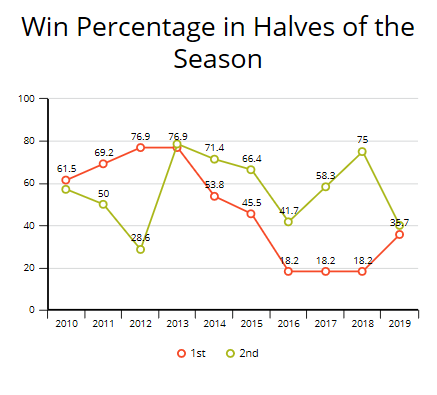
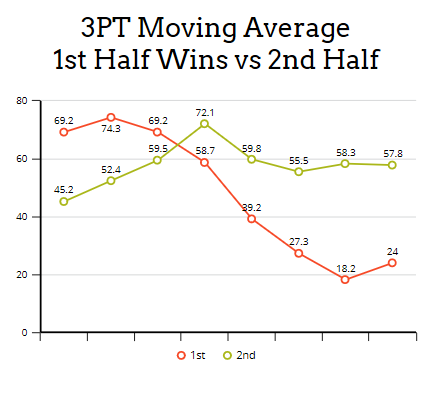
Everyone has their theories, but in the early 2010s, the consensus was we started well and finished badly. From 2010-2012, we lay in 4th, 3rd, 2nd respectively at the halfway point of the season. We finished those seasons in 5th (dropped 1), 4th (dropped 1), 7th (dropped 5). In these years, we won 19 of our 42 matches played in the second half of the season.
But something happened in 2013. Not only did we remain remarkably consistent throughout the season, winning 10 of our first 13 games and 11 of our last 14, we began to reverse that trend. When you look at the three-point moving average of our win percentages in each half, we begin to do better in the latter half of the season.
From 2013 onwards, we began to perform better in the second half of the season. In the 7 years since 2012, we've improved our position from the half-way point by an average of 1.8 positions on the ladder. We've had turnarounds that have seen us rise from 11th to 5th (in 2018), 11th to 8th (in 2017). Isn't that neat? Up to the first full rotation of fixtures since 2013, we've won 33 of 84 games. After the first pass, we've won 56 of 91.
Who is our bogey team of the decade?
We all have our theories about who and why certain teams are just harder to beat than others. Stats cut through theories to tell us the facts behind the unknown. When you look at just this decade, a disconcerting trend emerges amongst our opponents when you look at our win percentages against every team faced this decade in the Super League.
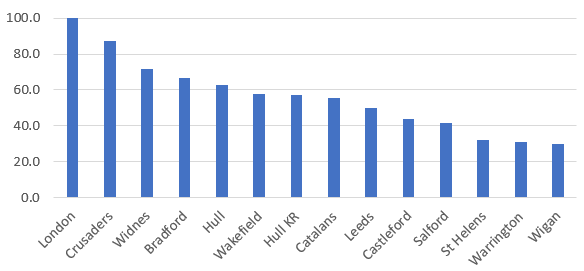
When you discount the most successful teams of the decade, this chart of our record in the Super League only (including playoffs), reveal that Salford are a team we have just not been able to beat with any regularity in the decade. Special mention for Castleford as well, our record of 11 wins and 14 losses contains a long stretch from 2016-2018 when we lost seven matches in a row against the Tigers.
But generally, something strange seems to happen when we play the team from Greater Manchester. In the 2013 season when we won the League Leaders Shield? We lost 21-20 against the Red Devils, who finished bottom that year. Since that date, we've only beaten Salford 4 times in 14. Our longest stretch of defeats against one side was Warrington - we didn't snatch a victory against the Wolves from April 2011 until March 2015.
Our record against the Top 5
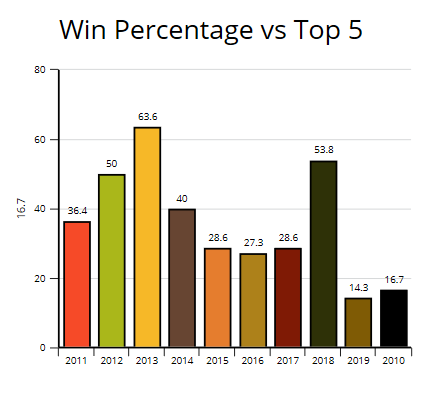
The Top 5 are so called because they are the best 5 teams in the game, their composition has changed over the decade, and has included the usual suspects of St Helens and Wigan alongside a revolving door of sides including Hull, Leeds, Warrington, Castleford, Huddersfield and Salford. Over the course of the decade, we have had, generally, a 1 in 3 chance of beating the sides at the top - although it is something to note that when we've been in the top 5 (more on that later), it's easier to get a higher percentage of wins as you play less matches against the teams at the top. Because you are one. For our methodology here, we've included games in the playoffs and Super 8s games.
In the last ten years, our win percentage has had it's ups and downs, in 2010 we struggled against the top sides with just a 16.7% win ratio, even with us finishing 5th in those years, it steadily climbed over the start of the decade, reaching a remarkably consistent 63% win ratio in the League Leaders Shield winning side of 2013. Since then, it's varied between 14.3% last season and 53.8% in 2018, our highest percentage since that 2013 year and our second best of the decade.
Dystopian Intermission: What if bonus points were a thing?
Remember when everyone was super stoked about bonus points and we were gonna introduce them next year (in 2010)? Well what if they did just that? What would be the effect? No one would really have the time to go through EVERY match of the 2011 season onwards and work that out, would they? Wrong. We did it.
Again, some methodology. We're working here on the Championship Bonus Point system, which awarded 3 points for a win, 2 points for a draw (yes, no golden point) and 1 point for a loss by less than 12 points. So here we go.
So, St Helens, unsurprisingly, don't make much movement and nothing actually really changes. Leeds and Wakefield, who had many narrow losses in the year, are bumped up to 7th and 8th respectively, at the expense of Catalans who fall 2 places. Castleford dart above Warrington thanks to their three draws in the season, and Huddersfield get four bonus points, for their losses at Wakefield (twice), their early season loss at home to Warrington and their four point loss to Catalans in July.
Who has the winning habit?
One thing we were interested in was who was our most successful player of the decade. Not by trophies, or points, but by wins. It's often said that some players have the winning habit, and fans are likely to say that some players are missed when they aren't on the field. Who are these guys and what do they do? Some just refuse to be beaten, some were here at the right time and some are just fierce competitors. We decided we wanted to find out who the most successful player of the decade was in terms of wins.
Now for the methodology. We've included all players who have played more than 100 Super League games in this decade, to ensure that they had longevity and to prevent outliers. Sorry Jon Molloy, your record of five games, five wins won't be counted here. Once we'd settled on this number, 14 players passed the test. They spanned the length and breadth of the decade, some playing in the early 2010s, some in the middle and some newcomers who have stuck around for long enough to pass the test. Some just started the decade and have played all the way through.
But we're not here to tell you everything, so can you guess the full list. It's hard, so we'll give you 10 minutes;
Partners