9 Apr 2020
The Numbers Game: Who is hardest to stop?
Cold, mysterious and elusive - only one of those can be quantified in Rugby League, so we did it.
You probably know by now, here at giantsrl.com, we have a special place in our hearts for stats.
We love stats so much, we invented a whole new stat just because we didn't like the stats that we already had.
Every stat, however, needs to start with a question, and there's been a question burning in the back of the mind of everyone here for some time now - who is the hardest Giants player to stop? To put it another way, who is our most elusive player?
The Oxford English Dictionary defines elusive as difficult to find, catch, or achieve. Achievement in the instance, is achieving the end of a play - meaning bring down and force a tackle. Tackles are the defensive currency of the game - but they're harder to quantify than the attacking currency - Points.
Tackles are harder to quantify as a tackling has a common goal - to stop the opposition from scoring - but contains individual factors that define a new set of conditions that make tackling more difficult or easier. For instance, imagine a run by a 110kg middle running at an 70kg pivot.
If it's a one-on-one, there's a good chance that if the middle runs at the pivot, he's going to knock him down and keep on going - if it's the other way, then the pivot might have better acceleration, agility and balance which will give him the edge on finding another route to run. Both have their limitations, both have their advantages.
But over the course of a season, you will find that that 110kg middle will come into contact with 120kg bigger middle, a 90kg edge player, a 100kg winger with speed and agility and a many different types of body sizes.
It will average out, and the players ability to beat a man or run through a man becomes the only common denominator. This ability to overcome most types of body type and position proves your ability to be elusive - so we need a stat for that.
The Old Boys - Traditional Metrics
So lets look at the traditional methods of analysing the difficulty players have to bring an opposition player down. Usually, we would look at metres - a standard indicator of the success of player. If a player has over 100m, they're run from one post to the other with the ball in hand.
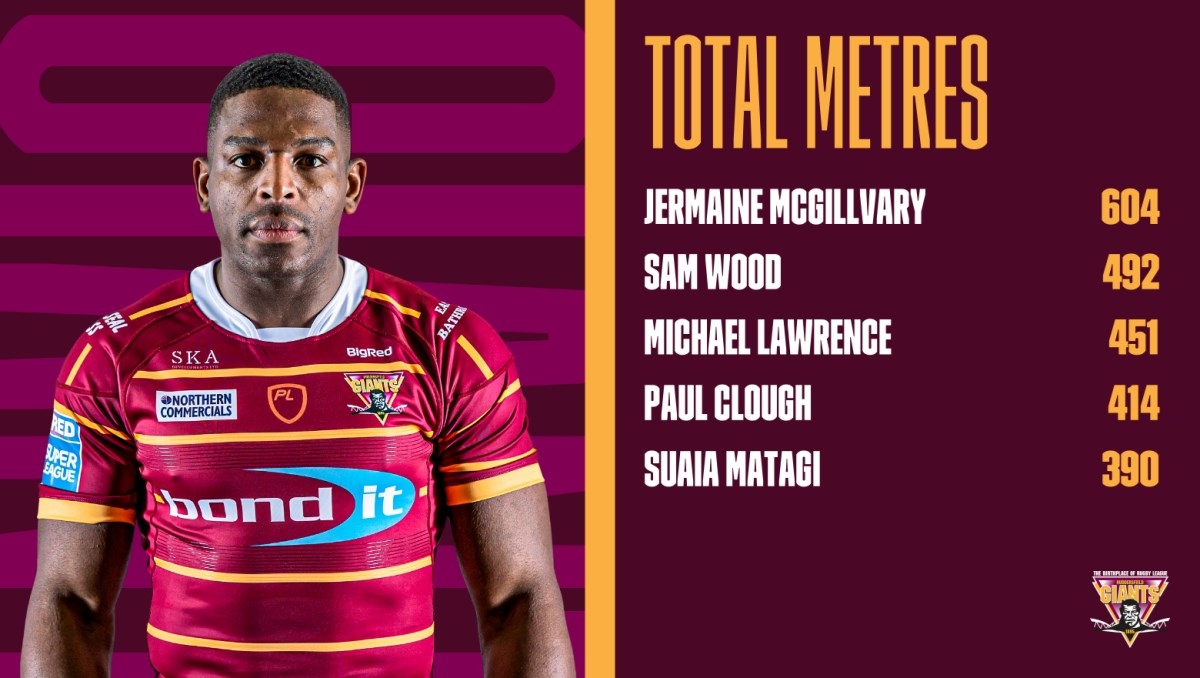
Our top metre-makers this year are; Jermaine McGillvary (604m), Sam Wood (492m), Michael Lawrence (451m), Paul Clough (414m) & Suaia Matagi (390m). They are players who have played in metre-making positions - two wingers & three middles. This makes sense. They're all players who carry the ball a high number of times (they have the 1st, 2nd, 3rd, 5th & 7th highest number of carries respectively).
This offers no help to see how elusive they are. Simply put, they're given a high number of attempts to carry the ball. Most players in these positions, most of the time, return a metre gain for each run, meaning they have an unfair advantage in the numbers. So, for a more in-depth look, usually, people look to two metrics - Metres Per Carry (M/C) and Metres After Contact (MAC). If you're familiar with the GiantsTV commentary of games, you'll be familiar with MAC - it's a favourite over there.
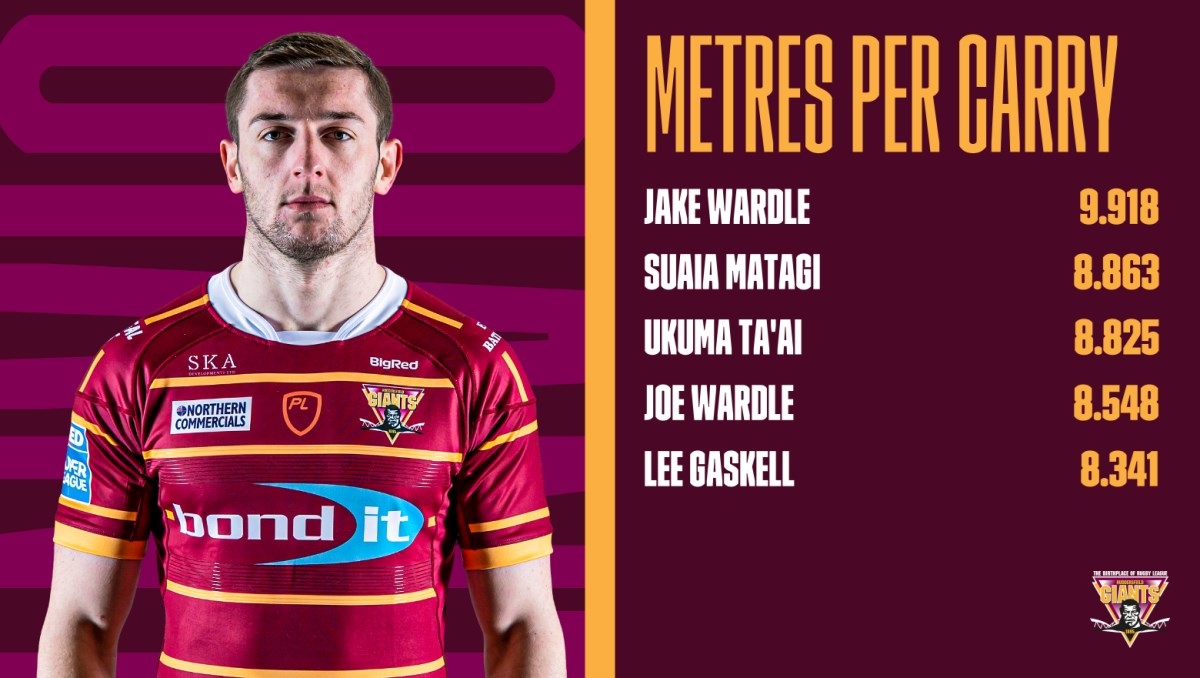
Metres Per Carry offers a good indication of the effectiveness of a run on average. Our friend from our previous chart, Suaia Matagi is here as well. But different players start to take to the fore. Jacob Wardle (9.9 M/C) leads the way, with our big metre-makers now in 15th (McGillvary), 13th (Wood), 14th (Lawrence) and 6th (Clough).
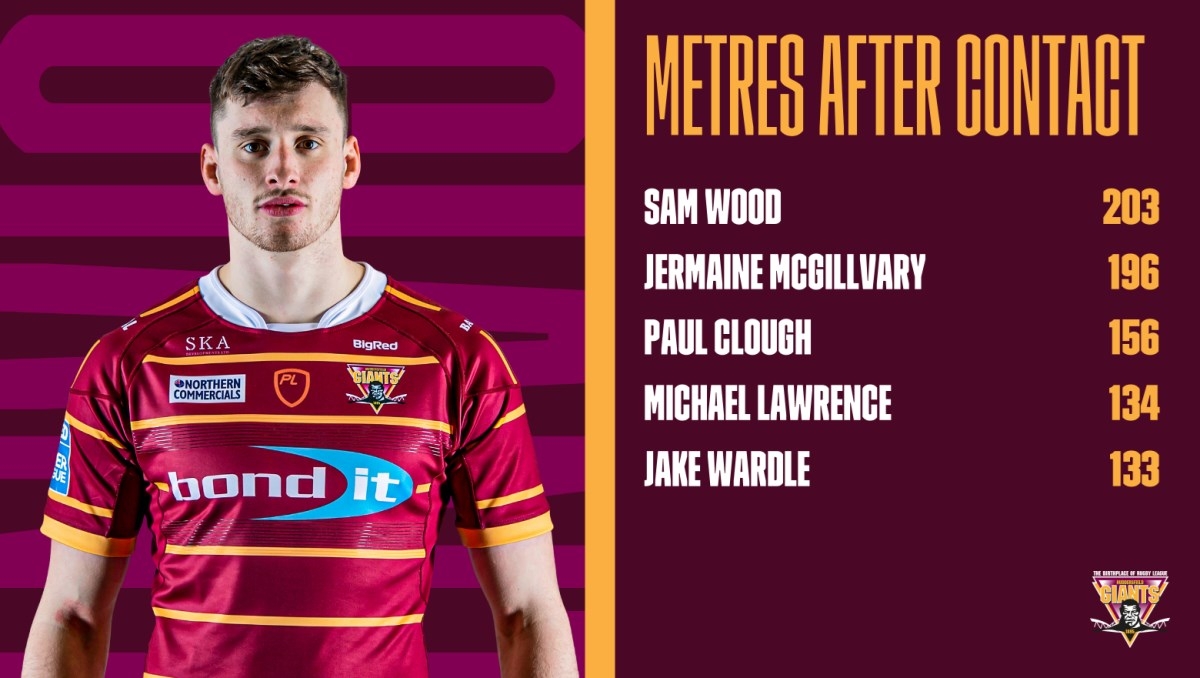
Metres After Contact indicates the metres made after initial contact. Sam Wood leads the way in this total, regulars to this investigation Clough (3rd), Lawrence (4th) and Matagi (6th) also making an appearance. It's important to note at this point, that Suaia Matagi has played a game less than everyone else.
If you want to delve a little bit deeper, we can start averaging out the numbers and trying to start rationalise odds and ends that make data uneven - averaging out the impact of missed games, differing levels of carries etc etc. A good starting point for any measurement of a players elusiveness from tackling would be Metres After Contact per Carry (MAC/C)
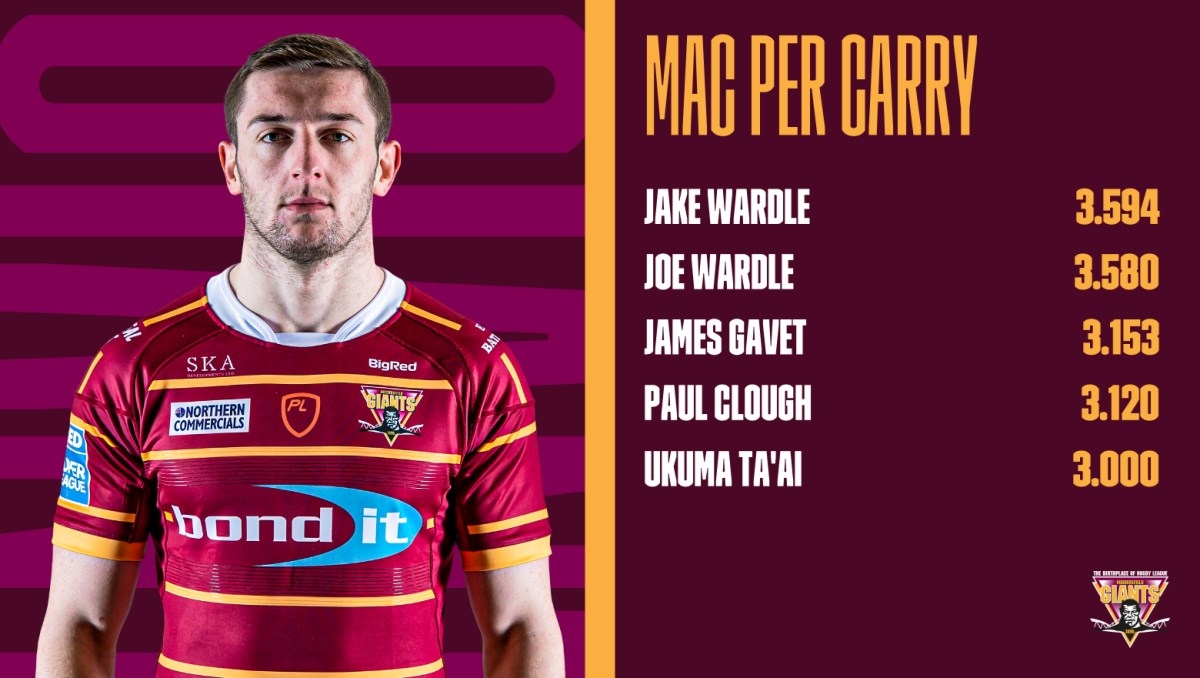
The premise is simple - this is the amount of Metres a runner makes after contact per carry of the ball. This separates those who have accumulated large MAC scores through accumulating large numbers of small metres from those who consistently post large MAC on a regular basis.
Jake Wardle once again tops the tree with 3.59 Metres After Contact Per Carry, meaning he's most elusive - right? Wrong. There are other ways to be elusive in the carry other than by making metres after contact. You can juke a tackle, you can hand-off, and you can force a missed tackle.
Opta records these stats into one number - defenders beaten. This measures the amount of times a runner has done anything to overcome a tackle and make more metres.
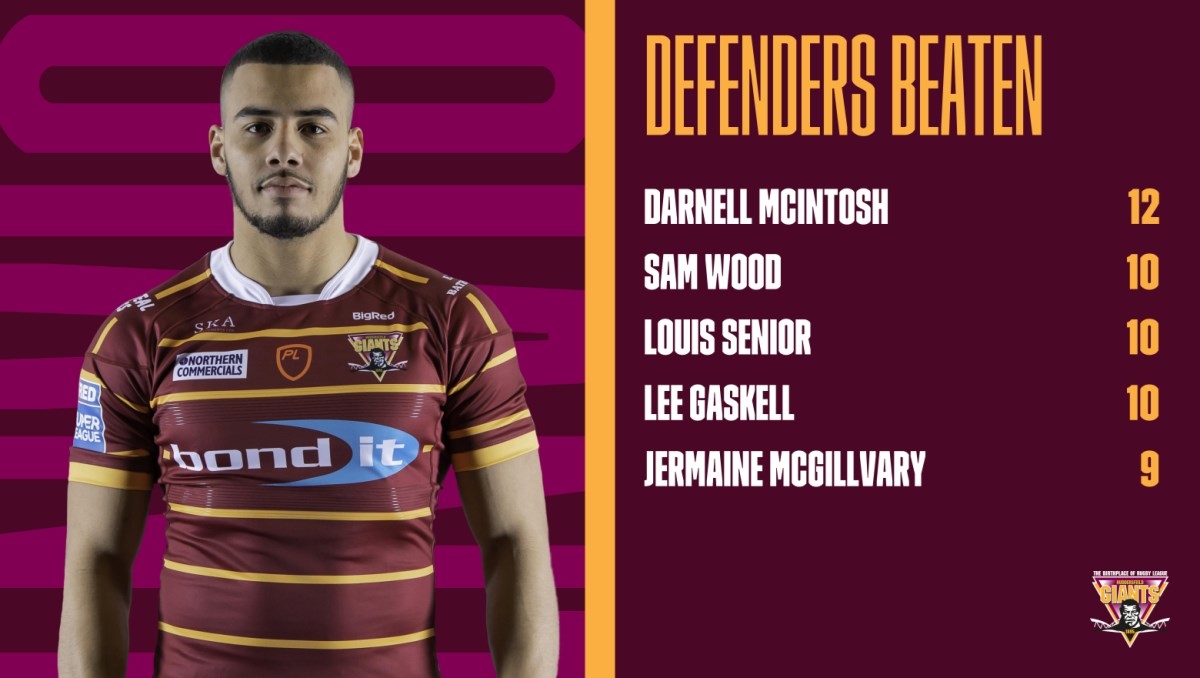
So in order to judge who is really elusive, we must take into account all these stats and find out some kind of index that measures them against each other. But don't worry - we've found one.
A stat for that
We've gone over a lot of stats, but none will have been newbies to the Numbers Game. This one is. Everyone welcome the Elusive Rating, or ER to it's close friends, to the room. Elusive Rating isn't new - it was developed by some good people who work on getting the most out of the cornucopia of numbers and metrics coming out of the NFL.
They sought to determine how hard a running-back was to pull down, judged by a simple enough equation to determine this;
[(Missed Tackles Forced/Carries]*[(Metres After Contact/Attempt) x (100)] = Elusive Rating
PFF.com rationalises that sum by saying;
"We combine a runner’s carries and receptions to give a total ball handling opportunities figure. We then combine the number of missed tackles that player forced against both the run and the pass to get a total missed tackles forced figure, which is then divided by the ball-handling opportunities.
"This figure then gets multiplied by a player’s yards after contact per carry average (*100) to get the final Elusive Rating. In essence the rating is a combination of how often players force missed tackles and how much yardage they generate after contact on a per carry basis."
Disclaimer - Rugby League is not the same as American Football. That's a given. This doesn't mean that the lessons learned from one facet of the game in gridiron cannot be moved to another sport. A running back breaking through a tackle and running to score is something that could easily be a Prop, a Second Row or a half-back.
So we've adapted this calculations to the numbers we have available - we have a Defenders Beaten number, we have a Metres Per Contact number, we have the carries also. So we have everything we need. This makes the equation slightly different, but in essence the same.
[(Defenders Beaten/Carries)*(Metres After Contact/Carries) x 100] = RL Elusive Rating
This multiplies, as the Elusive Rating from PFF signifies, the combination of all the tools available to a player to evade a tackle on their own.
The Numbers
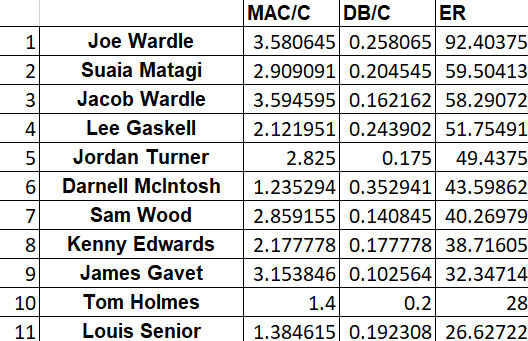
MAC/C = Metres After Contact Per Carry
DB/C = Defenders Beaten Per Carry
ER = Elusive Rating
So, according to our modelling, Joe Wardle is the hardest Giants player to stop so far in 2020. This isn't because he has the most of anything (he only featured in one of our previous stat leaders, albeit with a high 2nd in Metres After Contact Per Carry score), but because he is the most consistent player, adjusted by carries, to beat and gain metres while running independently.
Wardle beats his man at a rate of once every four tackles. That means anyone tackling against Joe Wardle will have a face to face meeting with Mr Turf 25% of the time. The only player in the Giants team hitting a higher level is Darnell McIntosh, but combined with a lower MAC/C, he only registers 6th in the overall ranking. Simply put, Joe Wardle is beating his man and driving his tacklers back when he is tackled.
Suaia Matagi's fine form in the early part of the season shows through this statistic also, with a nearly 3 MAC on every carry and a ratio of beating his man nearly 20% of the time. Lee Gaskell's ability to ghost a line, shown in his try in the game against Hull KR in which he beat three defenders, has held up with the club's third highest ratio of 24% of attempted tackles on his being missed. His running game was prevalent in 2019, and looks to be keeping up to scratch in 2020.
Like every stat, this can be interpreted differently and can be open to new modelling and decision making - just look at our modelling of API for more information. But this is just an attempt, backed up by the stats, to judge just who is hardest to stop in Claret and Gold.
Partners